
If c-store traffic is a barometer of economic anxiety for American consumers, this summer hasn’t been exactly carefree.
It should likely never have been expected in the first place: The slow-rolling impact of new tariffs, a slowing job market, aggressive anti-immigration tactics and creeping inflation was always going to take some time to emerge, and now we see it in the latest numbers from Jefferies Equity Research (examining sequential directional traffic shifts versus absolute trends).
Convenience store foot traffic declined sequentially by approximately 133 bps in July versus June, year-over-year (YoY).
- The sample set includes: 7-Eleven, BP full sites, Casey’s General Store, Chevron full sites, Circle K full sites, Cumberland Farms, Exxon full sites, Holiday Station full sites, Plaid Pantry, QuikTrip, Royal Farms, Rutters, Shell full sites and Wawa.
- That roughly aligns with what we heard in Goldman Sachs Beverage Bytes survey of c-store retailers a few weeks back: In-store traffic dropped 2% YoY in Q1, but improved in Q2, falling 0.2% from the same period last year.
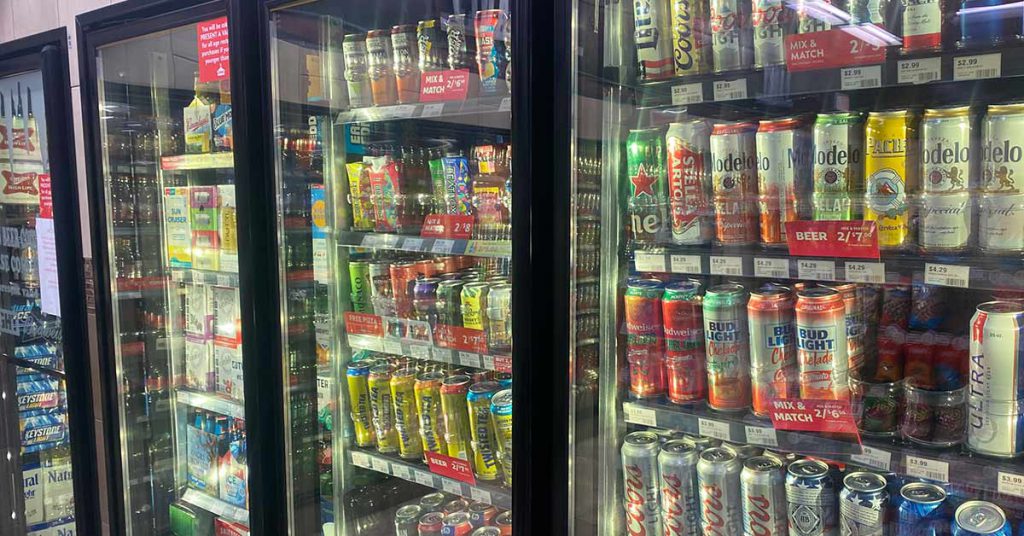
Beer sales decelerated, declining 3% over the last three-month period compared to down 2.7% over the last six months, as domestics (-3.6%) and imports (-1.7%) both in the red, Jeffries reported.
Convenience is the beer category’s largest source of off-premise sales, with nearly $13.3 billion in dollar sales (-2.7%) year-to-date (YTD) through mid-July in Circana-tracked retailers.
YTD through August 2, beer category (beer/FMB/cider) sales in the convenience channel are down 2.2%, while volume declined 4.3%, according to NIQ. Those trends worsened over the last four weeks (dollars -2.7%, volume -4.8%).
Only two segments – domestic super premium and cider – grew both dollars and volume YTD. Domestic super premium increased dollars 1.3% and volume 0.7%, while cider grew dollar sales 2.6% and volume 1.7%.
All other segments are in the red YTD:
- Imports -0.6% dollars, -2% volume;
- Craft -1.2% dollars, -3.4% volume;
- FMBs -0.8% dollars, -3.2% volume;
- Hard seltzer -.9% dollars, -3.9% volume;
- Premium regular -2.8% dollars, -4.6% volume;
- Premium light -7.8% dollars, -9% volume;
- Below premium -2% dollars, -4.2% volume;
- Malt liquor -5.9% dollars, -10.6% volume.
The negative trends have accelerated for many of those segments over the last four weeks:
- Imports -1.1% dollars, -2.4% volume;
- Craft -1.2% dollars, -3.3% volume;
- FMBs -3.8% dollars, -6.4% volume;
- Hard seltzer -0.3% dollars, -3.4% volume;
- Premium regular -2.3% dollars, -4.3% volume;
- Premium light -8% dollars, -9.5% volume;
- Below premium -3% dollars, -5.1% volume;
- Malt liquor -5.8% dollars, -9.2% volume.
The average case price of beer category products in convenience increased $0.71, to $32.85 YTD.
Sodas, Salty Snacks Struggle: Carbonated soft drinks (CSDs) and sports drinks have gotten stuck in the mud in c-stores over the three-month period ending July 12, per the report.
- Both saw volumes slide, -4.1% and -5.8%, respectively.
- Dollar sales were also down, but more for sports drinks (-4%) than sodas (-0.7%).
- Water’s drop picked up momentum as well, going from -4.9% sales growth in the six-month window to -6.4% in the three months, with volume falling sequentially to -6.5%.
Food was also pressured, with all top food categories reporting sales/volume declines six-month and three-month periods ending July 12.
- As consumers seek out healthier options within c-stores, they’re increasingly turning away from chips (corn -6%, potato -8%) and doughnuts (-5%) in favor of categories with “perceived higher nutritional value that are generally more filling,” Jefferies analysts reported, like meat snacks and breakfast sandwiches.
- Still, those categories have their own issues – volumes are down 1% and 2%, respectively.
Energy Resilient: They say Red Bull gives you wings, and c-store owners can attest to that fact: Energy drinks are seemingly unstoppable, accelerating growth over the three-month period ending July 12 to 10.4% (+9.1% in the six months) and far outpacing overall non-alcoholic beverages (+1.7% YoY in the three-month window, down slightly from +2% in the six months).
- That’s on the back of 8.3% volume gain, making energy drinks the only beverage category to report sequential volume growth.
- Per Jefferies: “Pricing is sticking, innovation is working, and new consumers are entering the category as consumers prioritize functional beverages.”
- It’s not just in c-stores, either: Powered by surging brands like Alani Nu ($301 million in revenue in Q2), energy drink sales grew 15.1% in the four-week period ended July 26 on the back of 12.7% increase in volume, according to the most recent NIQ multi-outlet numbers.
If this is how the category performs during a dip in c-store traffic, it’s fair to assume that growth will shift into even higher gear once those numbers rebound.
Justin Kendall contributed to this report.